🎯 The Two Dimensions of Market Efficiency
📊 Volume Efficiency
How much return was generated per unit of volume traded?
High volume efficiency = More return per share traded
Low volume efficiency = "Thirsty" stock that consumes capital
📈 Price Efficiency
How much of the price path was "useful" vs "wasted" in reversals?
100% efficiency = perfect straight line
Low efficiency = zigzag pattern with reversals
📊 Stocks Analyzed
Comparing 5 Hong Kong stocks from 2015-2026:
| Symbol | Name | Type | Expected Behavior |
|---|---|---|---|
| 0700 | Tencent | Tech/Growth | High volatility, trending |
| 0011 | HSBC | Banking | Stable, value |
| 0883 | CNOOC | Commodities | High volume, cyclical |
| 0001 | CKH Holdings | Conglomerate | Diversified |
| 0016 | SHK Property | Real Estate | Interest rate sensitive |
📊 Volume Efficiency Rankings
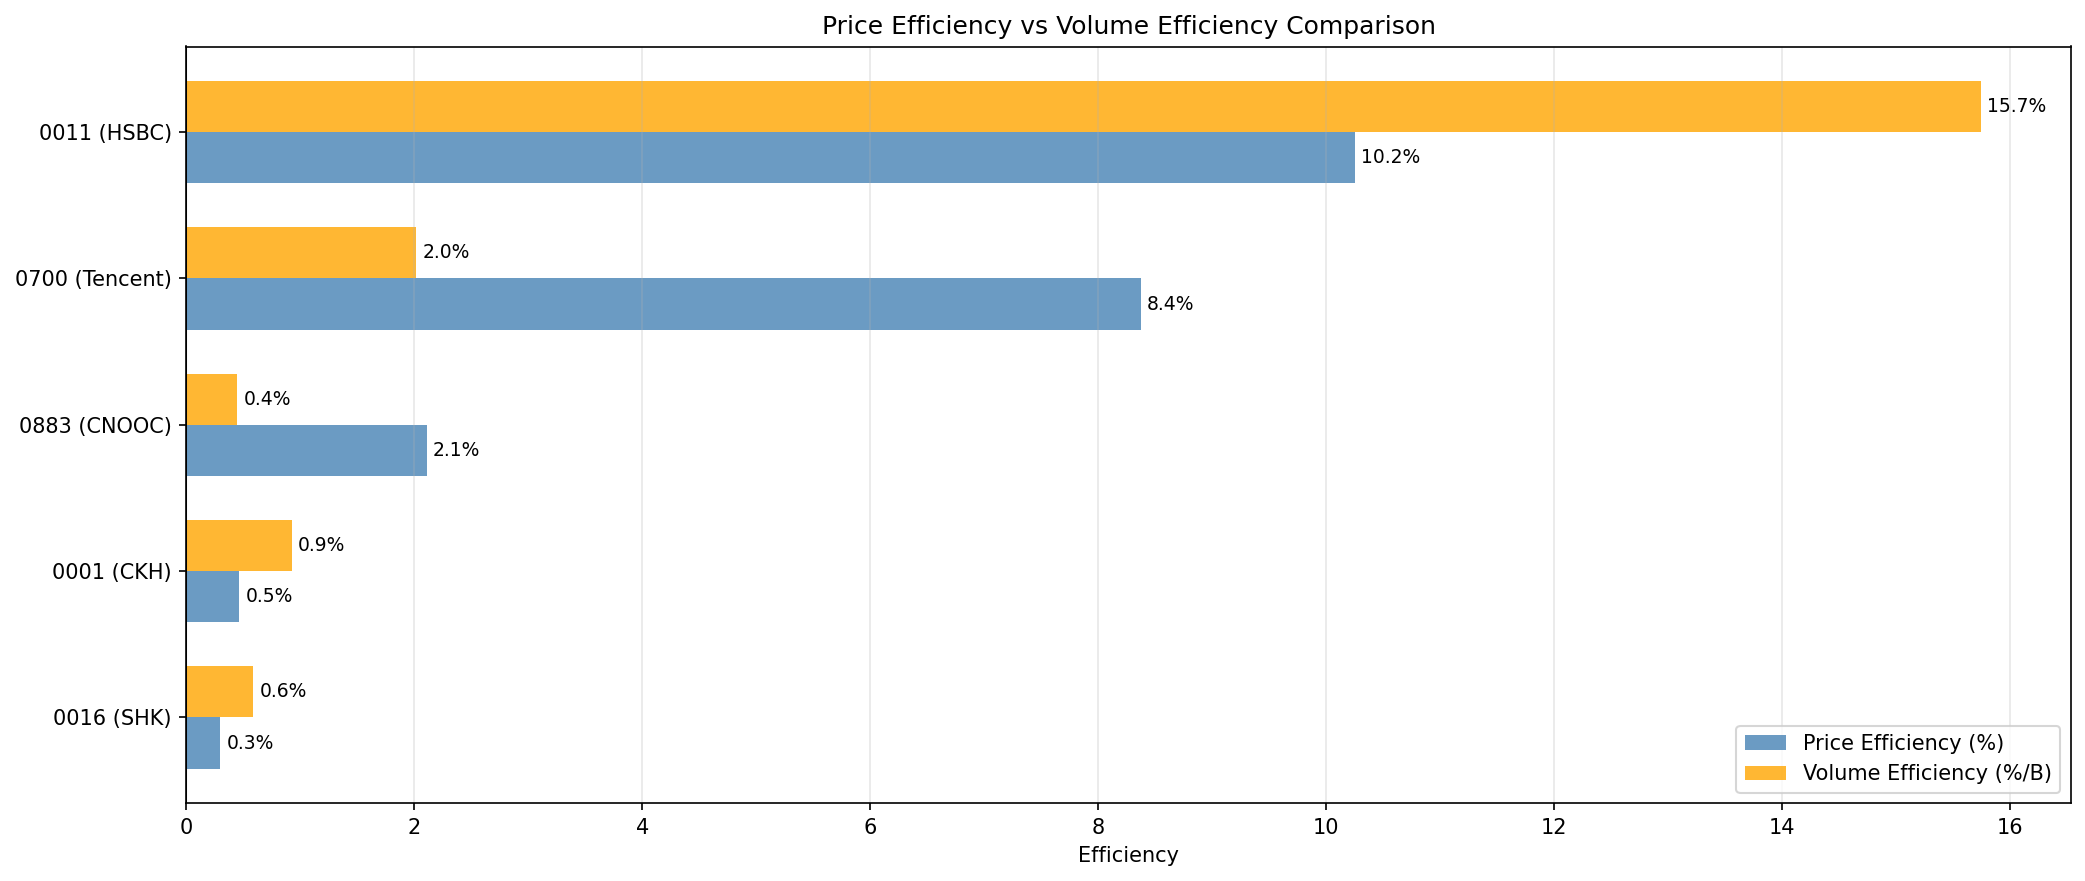
🔑 Finding: Volume Efficiency Varies 35x!
HSBC delivered +15.74% per billion shares —
meaning it generated excellent returns with minimal capital turnover.
In contrast, CNOOC required 361 billion shares traded
for +161% return, but only generated +0.45% per billion —
35x less efficient than HSBC.
Counter-intuitively: Tencent (+260% return) was only 13% as volume-efficient as HSBC (+86% return). More shares traded doesn't mean better returns.
📈 Price Efficiency: The Straight Line Test
Price efficiency measures how "clean" the price path was. If you bought at the start and sold at the end, how much of the journey was useful movement vs reversals?
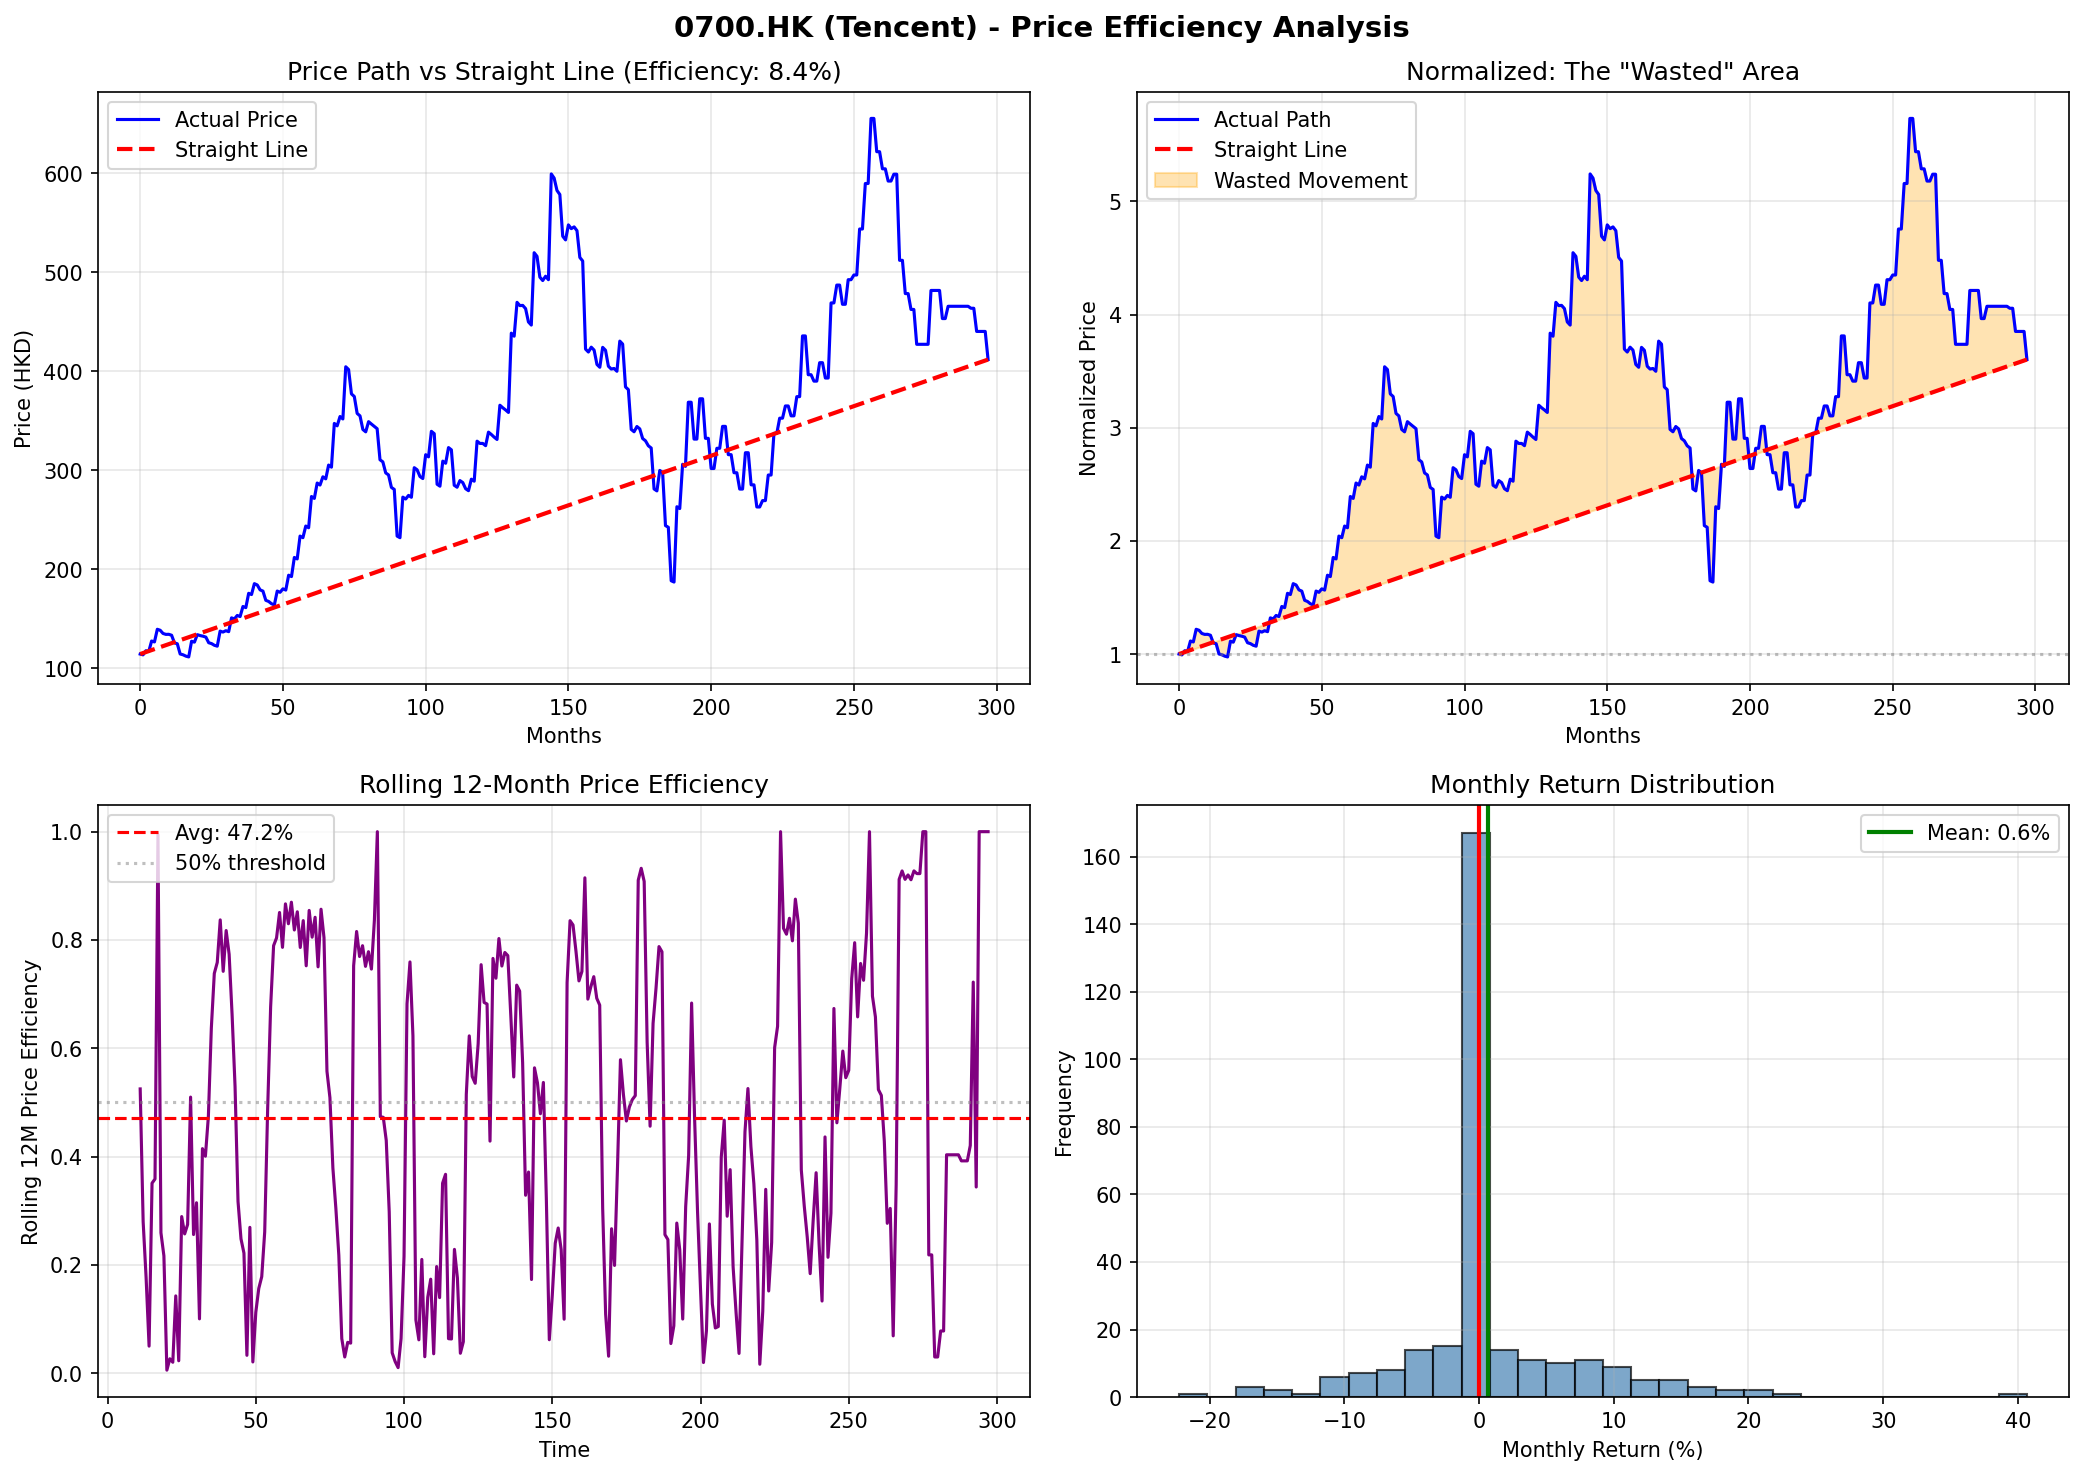
Tencent (0700) - High Volatility
For every 1 HKD of net gain, Tencent traveled 12 HKD
in total (sum of all ups and downs).
92% of the journey was "wasted" in reversals.
HSBC (0011) - Banking Stability
HSBC's efficiency was slightly higher (10.2% vs 8.4%), meaning its path was slightly "cleaner" — but both are still very inefficient.
- Timing matters enormously — bad entries can wipe out gains
- Stop-losses are essential — you'll be wrong on direction often
- The "straight line" from start to end rarely happens in real markets
🔍 The Full Comparison

Detailed Metrics
| Symbol | Net Return | Volume (B) | Vol Efficiency | Price Efficiency | Trend Score | Max DD |
|---|---|---|---|---|---|---|
| 0011 (HSBC) | +85.9% | 5.5B | +15.74% | 10.2% | +0.09 (sideways) | -52.8% |
| 0700 (Tencent) | +260.2% | 129.0B | +2.02% | 23.7% | -0.27 (down) | -68.8% |
| 0883 (CNOOC) | +161.1% | 361.5B | +0.45% | 2.1% | +0.07 (sideways) | -70.3% |
| 0001 (CKH) | +40.9% | 44.3B | +0.92% | 0.5% | +0.20 (up) | -77.7% |
| 0016 (SHK) | +10.8% | 18.4B | +0.59% | 0.3% | -0.06 (sideways) | -51.9% |
🔑 Key Insights
1. Volume Efficiency ≠ Returns:
Tencent returned +260% but was 8x less volume-efficient than HSBC (+86%).
More trading ≠ better returns.
2. Price Efficiency is LOW for ALL stocks:
Even the "best" (Tencent at 23.7%) means 76% of movement was reversals.
Markets don't move in straight lines.
3. Trending ≠ Efficient:
CKH Holdings had the best trend score (+0.20) but worst price efficiency (0.5%).
A stock can be consistently up but still zigzag wildly.
📊 VWAP: Volume-Weighted Average Price
VWAP is the average price paid by all participants up to that point. It acts as a fairness benchmark: if you bought above VWAP, you're likely underwater; below VWAP, you're likely ahead.
How to Use VWAP
- Above VWAP: Bullish signal, avg buyer profitable
- Below VWAP: Bearish signal, avg buyer losing
- Far above VWAP: Possible overextension
- Far below VWAP: Possible oversold
Limitations
- It's a historical average — doesn't predict future
- Stocks can stay below VWAP for years
- Best used with other indicators
🎯 Summary: What We Learned
1. Volume Efficiency is Key
HSBC delivered 15.74% return per billion shares — 35x more efficient than CNOOC. When allocating capital, consider how "thirsty" a stock is.
2. All Stocks Zigzag
Even the best stocks have <25% price efficiency. The "straight line" from start to finish is a myth. Expect reversals and plan accordingly.
3. Trending ≠ Efficient
A consistently rising stock (CKH +0.20 trend) can still be extremely price-inefficient (0.5%). Trend direction doesn't predict how clean the path is.
4. VWAP as a Baseline
VWAP tells you if the average participant is winning or losing. Use it to gauge entry quality, not as a standalone signal.
Questions for Further Research
- Does high volume efficiency predict future returns?
- Can we improve returns by trading only when price is far from VWAP?
- Is there a relationship between price efficiency and volatility?
- Do "expensive" (low volume eff) stocks eventually become cheap?
📅 NEW: Timeframe Analysis
We extended the price efficiency analysis to different bar sizes (1d, 5d, 20d, 60d) and discovered something fascinating: efficiency increases dramatically with larger bars.
🇭🇰 NEW: HK ETFs - No Stamp Duty!
Key insight: ETFs have NO stamp duty in HK, making daily mean reversion viable! We compared ETF vs stock mean reversion and found ETFs dramatically outperform.
Analysis using EODHD data | QuestDB | Python